Decarbonization Planning Guide
Get to Know Your Building
Energy and GHG Emissions Benchmarking
You can’t manage what you don’t measure. Start your building on the path to improvement.
Energy and GHG benchmarking is a regular process which tracks a building’s annual energy use and compares the building’s current performance against both its past performance and to similar buildings both locally and nationwide. Energy benchmarking is the first step to identifying opportunities to reduce energy use and save on utility bills and is an important tool to help determine whether a building is on track to meet its performance goals.
Benchmarking your building can be used to compare energy and cost performance year-over-year, compare to similar buildings, and to better identify when a property is underperforming. Reviewing your benchmarking data regularly will allow you to understand where there are opportunities to improve performance.
This section discusses where benchmarking is mandated in Illinois and where it is voluntary, outlines key steps to implementing benchmarking for your building, and provides guidance on what benchmarks are appropriate to compare your building against. This section also provides links to additional resources to help guide your benchmarking process.
Benchmarking Requirements in Illinois
Benchmarking requirements vary across the state of Illinois. Currently, energy and water use benchmarking are required for privately owned buildings over a specific square footage in Chicago, Evanston, and Oak Park. However, anyone can participate in voluntary benchmarking. The links below have more information on the jurisdictions where benchmarking is required:
- MEEA Illinois Benchmarking Policiesjurisdictions where benchmarking is required
- Chicago Energy Benchmarking Homepage
- Evanston Benchmarking Ordinance
- Oak Park Benchmarking Page
Key Steps
- Choose a benchmarking lead within your organization. The benchmarking lead either coordinates or performs data collection and entry and interprets results for management. If you decide to work with a benchmarking service provider, the benchmarking lead serves as the main point of contact to streamline the flow of information. The property manager might fill the benchmarking lead role, or an energy or sustainability manager if one exists.
- (Optional) Choose a benchmarking service provider. All benchmarking tasks can be performed in-house; however, an organization can choose to contract with an external service provider to do the work on their behalf to reduce internal labor or leverage a service provider’s expertise. Several lists of benchmarking service providers with contact information are provided at the end of this section.
- Create an account in ENERGY STAR Portfolio Manager. Developed by the EPA, ENERGY STAR Portfolio Manager is a free web tool commonly used for energy, water, and waste benchmarking. It streamlines data collection and management and supports benchmarking an entire portfolio of buildings. The tool uses data to generate the ENERGY STAR Score for each building, which is perhaps the most widely used and accepted metric comparing a building’s energy performance to its peers. More information to get started can be found in the Portfolio Manager Quick Start Guide.
- Gather and enter data. Collect data on your building and enter it into the benchmarking tool. The benchmarking lead might do this by themselves or coordinate with internal and external partners such as building managers and maintenance teams, accounting, or benchmarking service providers. Data usually comes in two forms: whole-building descriptive data such as gross square footage and use type, and energy-use data, which often comes in the form of utility bills or from a utility data portal such as ComEd, PeoplesGas, or Ameren Note: Nicor Gas is still developing their portal; a temporary solution is documented by the City of Evanston Benchmarking guidelines.
- Verify data is correct. Some benchmarking ordinances require a professional with credentials to verify a building’s data every three years. Even if not externally required, verifying data is a best practice and helps ensure that benchmarking results are accurate. In some cases, an employee of the building owner can conduct the verification if they have the necessary credentials; in other cases, verification must be done by a third party. Consult the relevant jurisdiction’s benchmarking ordinance website or the ENERGY STAR website for a list of accepted professional credentials. A list of service providers offering verification services is also available here.
- Report and interpret results. Once data entry is complete, benchmarking tools automatically generate results in the form of metrics comparing the building to others like it. Report results internally to the management team. In jurisdictions with required benchmarking, follow their reporting guidance to ensure compliance.
- Act on results. Benchmarking results provide valuable data to guide further energy actions and investments in your building. For example, organizations with a portfolio of buildings can use the results to identify the most promising candidates for energy upgrades. Results might help identify ways to bring buildings into compliance with building performance standards. Having an understanding of your energy use year over year gives you a leg up to prepare for decarbonization steps.
Benchmarking GHG Emissions
Benchmarking GHG emissions is an additional step after benchmarking a building’s energy use. Although Illinois jurisdictions currently don’t require buildings to report emissions, GHG benchmarking is a useful tool for meeting other sustainability goals or internally driven emissions reporting. GHG benchmarking is a crucial component in a carbon audit for a building and provides a baseline to track the impact of future improvements.
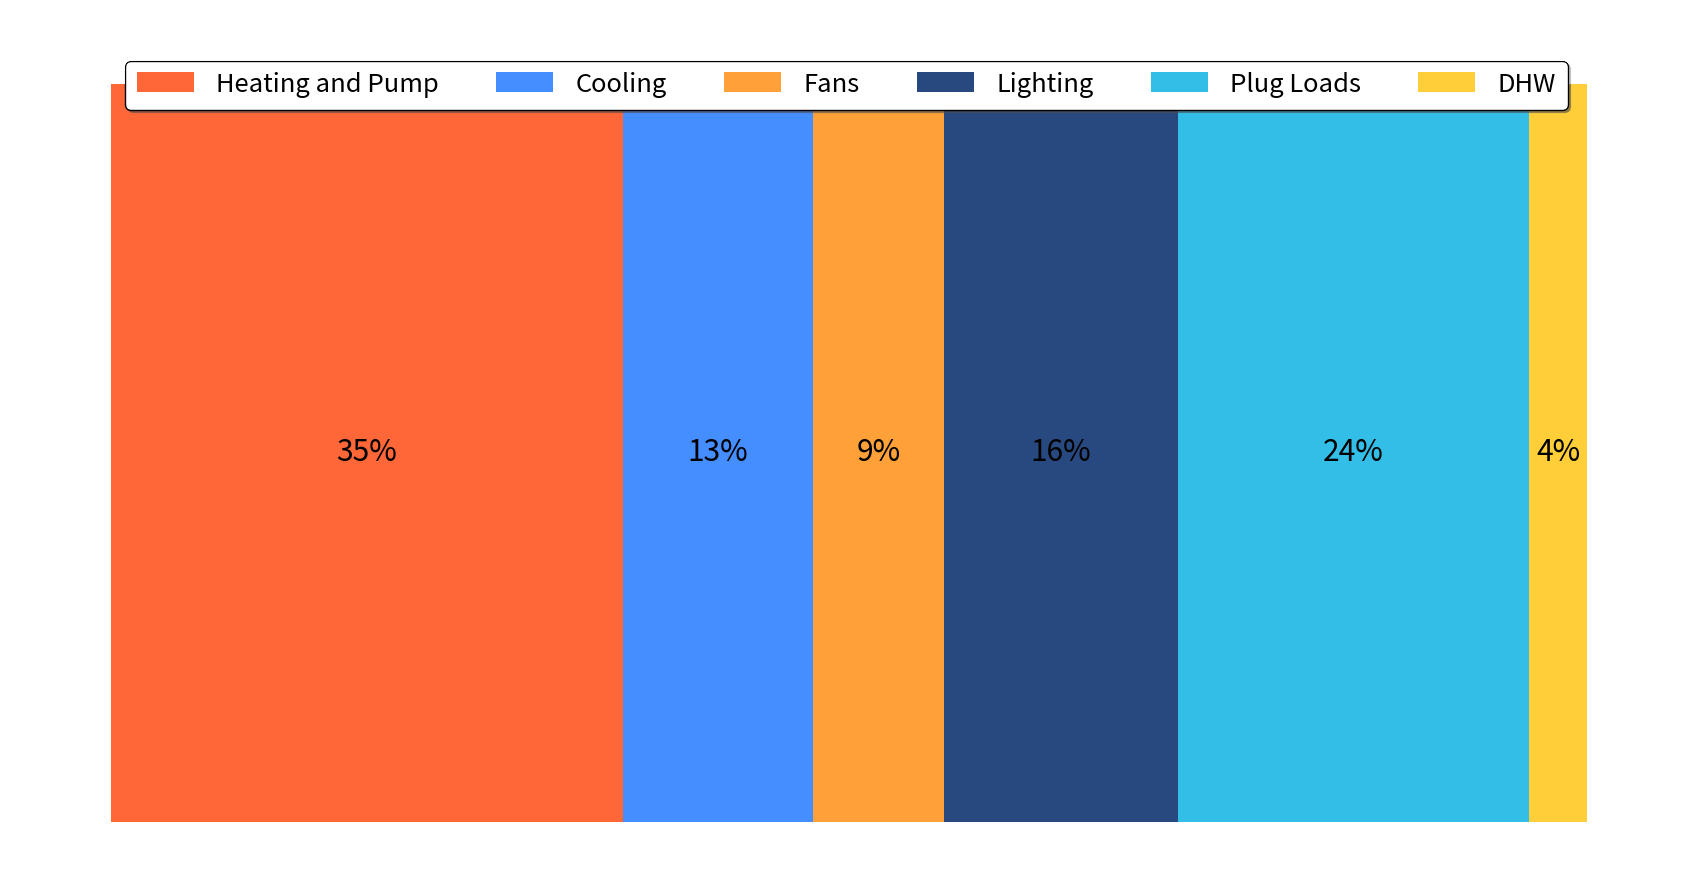
GHG emissions benchmarking from energy alone does not paint a complete picture of a building’s emissions because it does not account for emissions from other sources such as refrigerant leakages , embodied carbon in the building materials, or emissions from purchased commodities while operating the building. However, energy consumption accounts for most of an existing building’s total emissions, so extending energy benchmarking to calculate a GHG emissions benchmark captures a large majority of a building’s GHG impact. The next figure shows how much different end uses contribute to a typical building’s emissions.
Who could do this work?
Benchmarking involves several tasks, including: collecting descriptive data on a building, collecting energy use/utility data, entering data into the benchmarking tool, and interpreting and reporting results. In some organizations all the work might be done by a single person, the benchmarking lead; in others the work might be divided among a benchmarking team or between departments. In many cases, the benchmarking lead will have to communicate with others to secure necessary data. For example, they might have to work with accounting staff to obtain utility bills or with the facility engineer to collect building data such as size or operational parameters.
In cases where an third- party service provider is hired to complete benchmarking for the building, their scope of work might involve a few discrete tasks or be a full turnkey solution, including reporting for compliance. Benchmarking could be written into the scope of work of an Emissions Reduction Audit (see section 2C). A list of service providers is available here.
To benchmark GHG emissions from energy, multiply the amount of each type of energy (electricity, natural gas, fuel oil) consumed by a building by an emissions factor for that type. The emissions factor represents the amount of GHG emitted for every unit of energy consumed. Several sources have useful emissions factor data:
- EPA GHG Emission Factors Hub: This page has PDF files with emissions factors for fuel combustion and links to some other data sources such as eGRID.
- Emissions & Generation Resource Integrated Database (eGRID): eGRID is a database which provides emissions factors for electricity use. Since different parts of the country use power generation sources such as solar, wind, coal, nuclear, or natural gas in different amounts, eGRID gives a geographic breakdown of the emissions factors for different regions. The Summary Data and Power Profiler sections are quick ways to find an appropriate emissions factor for electricity consumption.
- Cambium: Cambium is a dataset created from a model which forecasts future emissions from the electrical grid as renewable sources gradually account for a larger share of generation. This data is useful for predicting the emissions impact of building energy improvements into future years. Cambium’s current projections go to 2050.
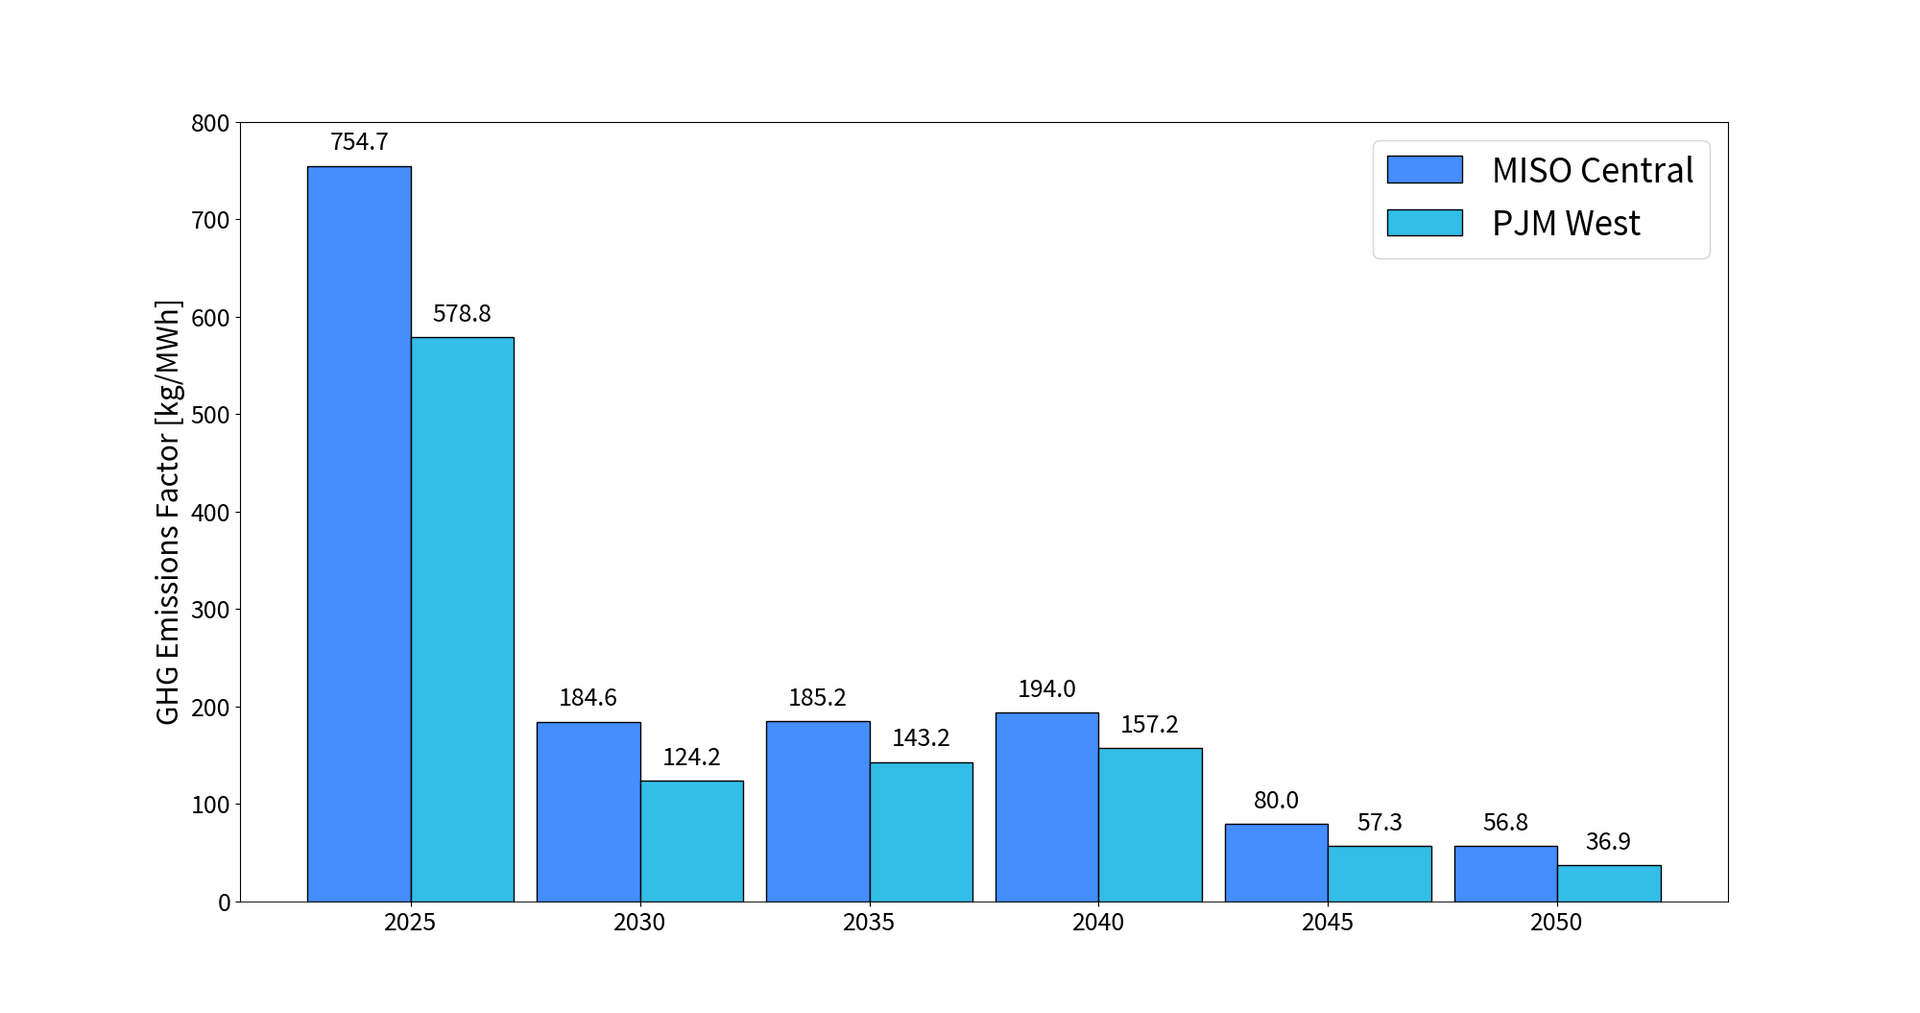
The next figure shows the expected emissions factors for the Illinois electrical grid through 2050; this information is derived from NREL’s Cambium tool Mid-case Long Run Marginal Emission Rates. These factors can be used to help estimate future emissions under possible plan scenarios.
The Illinois grid is composed of two regions, MISO Central and PJM West. To find out which region your building is in, refer to this map.
The Greenhouse Gas Protocol offers extensive standards, tools, and education on creating an inventory of GHG emissions. It is useful both for benchmarking utility emissions and more comprehensive inventories including life cycle analysis and emissions audits.
There isn’t much data available that allows a building to compare its GHG emissions to similar buildings. One resource is ASHRAE Standard 100, which offers data and formulas to calculate a GHG emissions standard for different building types in climates across the US. GHG benchmarking is still useful when done over multiple years to see if building improvements are working.
Additional Resources
Energy Benchmarking
- Building Energy Resource Hub Energy Benchmarking Page
- Energy Star Benchmarking Starter Kit
- Energy Star Portfolio Manager
- MEEA Illinois Benchmarking Policies
- List of Benchmarking and Data Verification Service Providers
GHG Benchmarking
The table lists the emissions factors of common heating fuels that, unlike the grid, are not expected to be cleaner over time.
| Heating Fuel | GHG Emissions Factor [kg per million Btu] | GHG Emissions Factor [kg per MWh] |
|---|---|---|
| Natural Gas | 53.1 | 181.2 |
| Fuel Oil | 74.2 | 253.2 |
| Propane | 63.1 | 215.3 |